To read this newsletter in an easy pdf format, click here to downloadA Case for Fresh Fruits and Vegetables
We all care about food and nutrition and we probably feel well-versed in many issues that relate to good health. One truth that we hear repeated again and again, so often in fact that we may take it for granted, and without much thought, is that fresh fruits and vegetables are priced out of reach and too expensive to be a mainstay in the diet of the typical American family.
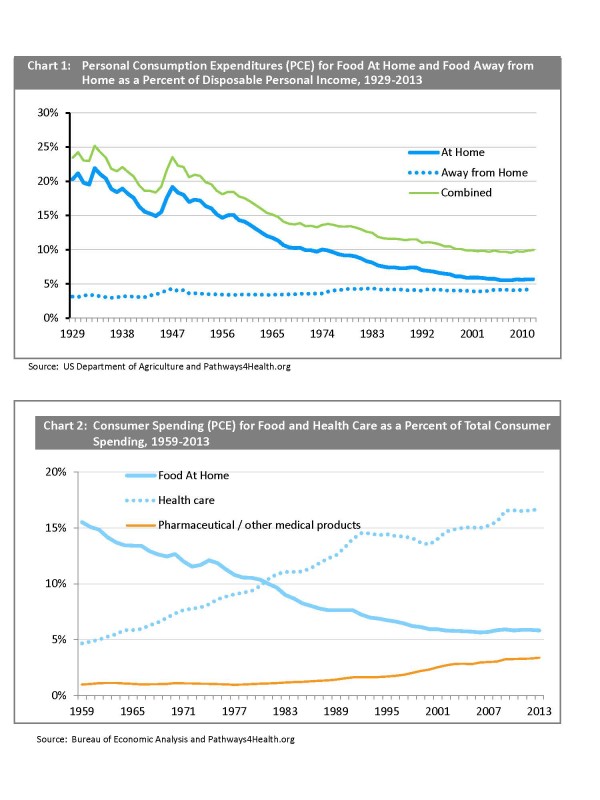
As a former economist and someone familiar with government economic statistics, I have watched food lose share of the consumer dollar year after year as we give a greater priority to other goods and services, especially high-tech and recreation durables and health care services: In the early postwar period, Americans spent 24% of every dollar on food; today, we spend less than 10% (Chart 1). In recent decades, we seem to have traded food dollars for dollars spent on health care (Chart 2).
The apparent shift in our preferences away from food toward other goods and services got me thinking:
Questions
What factors explain the dramatic decline in the food/disposable personal income (DPI) ratio in Chart 1?
If we devote so little of our income to food relative to 50 years ago, isnt there room in the budget to give a little more emphasis to food in general and fresh fruits and vegetables in particular? [We can use fresh fruits and vegetables, for which there is historic data, as proxies for nutrient-dense, health-supportive foods.]
Does price explain the steep drop in the food/DPI ratiothe food industry presenting us with cheaper food options and savings so we can spend more for other goods and services?
How much of the typical consumer dollar goes to fresh fruits and vegetables?
Have the prices of fresh fruits and vegetables gone up that much more than other foods, as well as all other consumer goods and services, to render fresh produce unaffordable?
What else is the typical American family buying that makes fresh produce feel so unaffordable?
Overview and Conclusions
The charts and tables that follow represent ideas and concepts derived from raw data available through the Bureau of Economic Analysis, a division of the Department of Commerce.
The data suggest that some of the overarching influences on consumer spending have come not only from the relative prosperity of the postwar years, but also specifically from the growth and influence of the food and drug industries, the development of new high-tech products and medical technologies, and the powerful role of low-cost imports. Imports, by complementing and competing with domestic products, have had a major impact on consumer behavior and shopping habits, especially in recent decades.
The story of postwar consumer spending, the expanding market basket of goods, and the role of imports is a fascinating one and the conclusions below are perhaps more easily understood in this context. But in the interest of brevity and not to be sidetracked by too much history and too many statistics, many of which are captured in the tables and charts, lets focus here on just a few summary thoughts and leave this story to be told in the Appendix of this newsletter, if you would like more background on the topic.
While you may develop ideas from the charts and tables on your own, these are some specific conclusions that I draw from them:
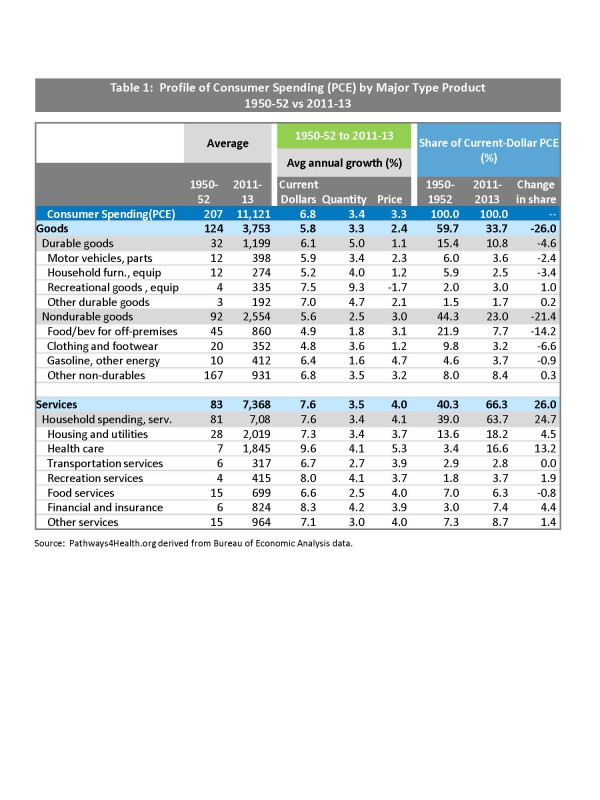
- Americans have dramatically cut back on their relative spending for goods across virtually every expenditure category in order to purchase more services. Since the early 1950s, consumers have diverted 26 cents of every dollar from goods to services; with half, some 13 cents redeployed to health care services (Table 1, last column).
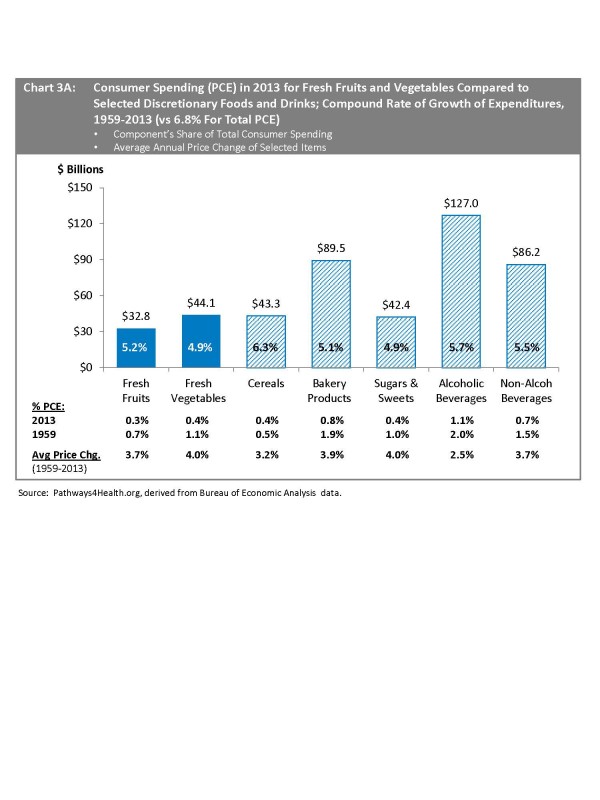
- As a nation, we spend about three times the amount for alcoholic beverages than for either fresh fruits or fresh vegetables. We spend twice the amount for non-alcoholic beverages (especially sugary soft drinks) and twice the amount for bakery products than for fresh fruits or vegetables. And, we spend a roughly equivalent amount for sugary snacks and sweets compared to fresh fruits and vegetables (Chart 3A).
- From what we hear about the high cost of fresh fruits and vegetables, we might assume that their prices have outpaced prices of such consumer favorites as beverages, bakery products, and sugary snacks, but Chart 3A suggests that this is not the case. Prices have inched up in like fashion for all of the food categories depicted in Chart 3A. The fact that consumers have increased their spending on all these categories at essentially equivalent rates suggests that taste and convenience, not nutrition and health, may be the key priorities when Americans stroll the aisles of grocery and convenience stores (Chart 3A).
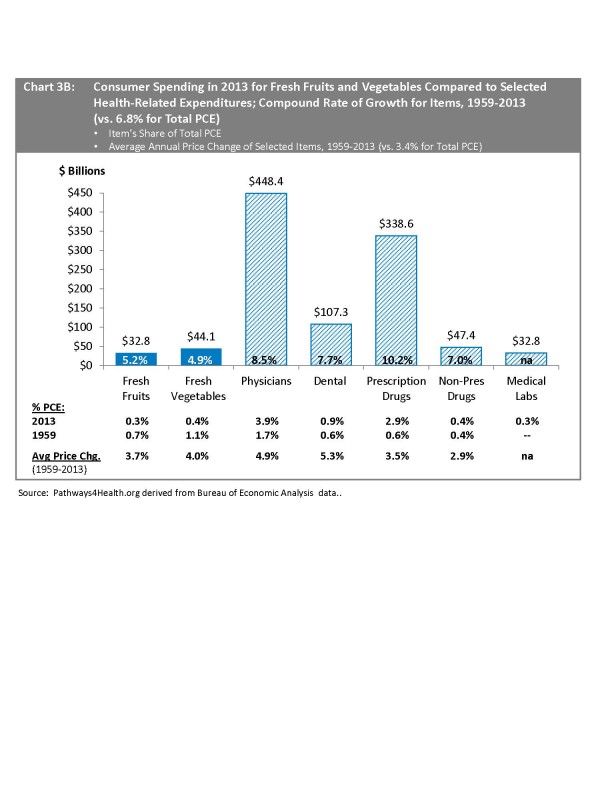
- Amounts spent for physician care and also for prescription drugs each account for 8-10 times the dollars we spend on fresh fruits and vegetables (Chart 3B). Prescription drug sales have grown at twice the rate of spending for fresh fruits and vegetables (10.2% vs. 5.2% and 4.9%, respectively) and its share of PCE has increased by almost five-fold in the last 60 years to now account for almost 3% of total consumer spending (vs. 0.3% for fresh fruits!). Americans also spend more for non-prescription drugs than for fresh fruits or fresh vegetables (Chart 3B).
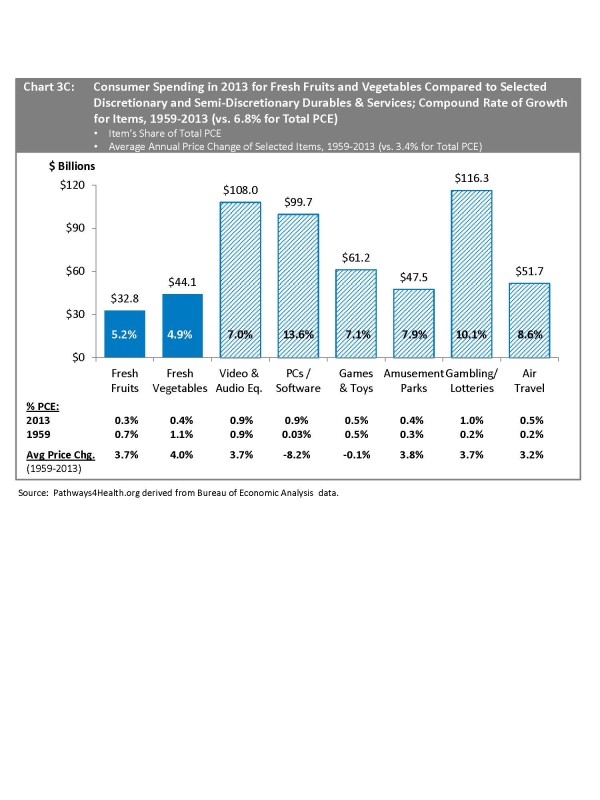
- Americans spend more on amusement parks, toys and games, air travel, and gambling and lotteries than on fresh fruits or fresh vegetablesthe latter by a wide margin. Spending for gambling and lotteries (presumably a highly-discretionary expenditure and one that entices most economic classes) has grown at twice the rate of fresh fruits and vegetables and absorbs three times the dollars (Chart 3C).
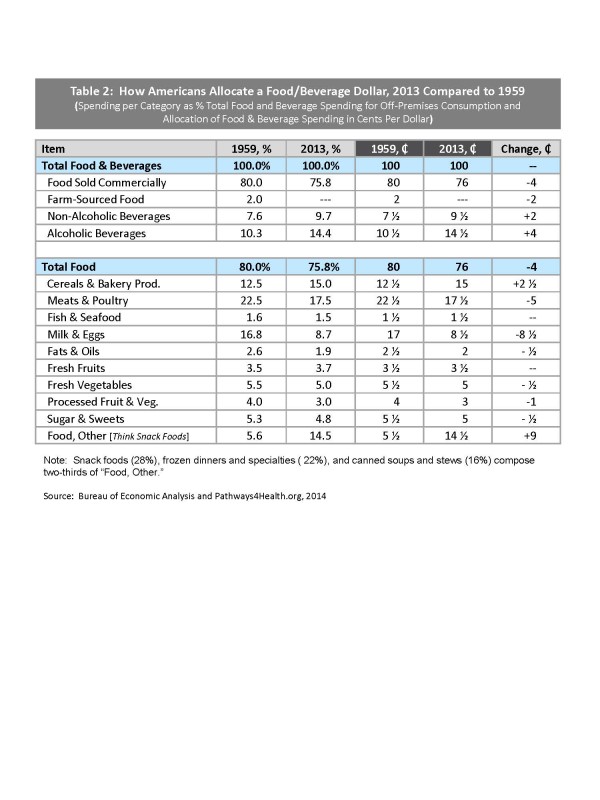
- Compared to 60+ years ago, consumers are spending less of every dollar on food and more on beverages of all types (Table 2). Of every dollar spent on food, consumers have shifted 13 cents away from meat, poultry, milk and eggs, in order to spend 11 cents more on cereals, bakery products, and other food which includes convenience snacks and frozen and canned prepared foods. Economizing efforts have aimed most at milk and eggs, where consumers have cut back 8 cents in order to spend 9 cents more of every dollar on snacks and frozen/prepared foods.
Answers
- Prices for fresh fruits and vegetables have not run wild; instead, they have risen only moderately faster (3.7% and 4.0%, respectively) compared to food overall (3.1%) and consumer goods and services as a whole (3.3%);
- Fresh fruits and vegetables account for such a negligible portion (0.3% and 0.4%, respectively) of the consumer dollar that price increases should be relatively easy to absorb;
- Fresh produce appears affordable in the context of the many dollars consumers spend on discretionary items like alcoholic beverages and soft drinks, amusement parks, gambling and lotteries.
We know that Americans as consumers are rational beings. From the data, we might conclude that what many are short on is really not so much money, but time. With more women working outside the home; with households having fewer hours to devote to planning, shopping, and cooking; and, with screens, especially the internet soaking up more hours of our day, it is easy to be caught off guard, needing a calorie lift and with no healthy food options in sight. It is then that consumers reach for quick options like soft drinks and snack foods.
Without adequate time to shop, cook, and prepare healthy meals and with the satisfaction and convenience provided us by the food industrys array of sugary beverages and snacks, it is easy to see why the myth that fruits and vegetables are unaffordable has gained in popularity and gone unchallenged.
Copyright 2014, Pathways4Health.org
Appendix
Overview of Consumer Spending in the Postwar: The Shift Away from Staple Goods, Toward Discretionary Hard Goods and Services
A Discussion Shaped, in Part, by Data Outlined in Table 1
Relative peace and prosperity following World War II ushered in a period of unprecedented growth in consumer spending, as well as major shifts within the consumer market basket itself. To the first point, the modern consumer economy as we know it today initially grew out of strong pent-up demand especially for durable goods following World War II. In these early postwar years as the war effort cooled, strong consumer demand for goods came to the rescue to keep factories humming and workers on the job, filling the void left by a government no longer purchasing armaments and war materials: In the three years between 1943-44 and 1947, government spending dropped from 48% of GDP to 16%, while the consumer share rose over the same three years from a wartime-depressed 48%-49% of GDP to 65%. [Federal spending soared, from $16 billion in 1940 to $109 billion in 1944, and then fell sharply, from $109 billion to $43 billion in 1946 and $40 billion by 1947.]
To this day, the postwar consumer economy has continued to flourish, driven and nurtured by an environment of general affluence, the absence of global wars, and the influence and ability of advertising and the media to persuasively and effectively turn consumer wants into perceived needs. Speaking to this marketing success is the fact that, after hovering at about two-thirds of GDP throughout the postwar period, the consumer share of GDP is currently at an all-time high of some 68%.
Not only has the consumer market basket grown in the postwar years, but the mix has also changed. Consumers can now purchase many more types of goods such as high-tech durables, as well as many discretionary and health-related services. These goods and services have encroached upon traditional consumer staples. Two dramatic changes in the way consumers allocate spending dollars are illustrated in Charts 1 and 2 on the page that follows. Americans now spend less than 10% of disposable personal income (DPI) on food, both at home and away from home, a steep decline from the 24% food/DPI ratio of the early postwar years, with the entire shortfall explained by food at home. Simultaneously, as foods share of the consumer dollar has fallen, more spending has gone to health care (Chart 2).
The role of imports. Imports have grown steadily throughout the postwar period. In dollar volume imports are the equivalent of 16% of GDP, up from a 4% average in the 1950s. The stunning growth of imports means that the American consumer can select as never before across an even broader spectrum of productsfrom big-ticket items like automobiles to bargain-priced electronics, clothing and shoes.
Beyond greater choice, imports provide economies, due to their generally lower cost and also the competition they exert on domestic producers. As a result, Americans spend fewer dollars per unit on such items as TVs, other electronics, and soft goods. In the case of hard goods like TVs and computers, we are able to buy more units per household using relatively fewer dollars; or, in the case of goods like clothing, we can buy a like number of units for less money, leaving more dollars for other purchases.
Over the postwar period, the impact of importsdue to price and competitionhas been a factor allowing consumers to shift more and more spending dollars from goods to services, especially health care and financial services. Currently, the typical American spends 66 cents of every dollar on services and only 34 cents on goods, a relationship that has nearly flip-flopped over the last 4 decades (Table 1). Services, which are generally a product of domestic labor and little influenced by lower foreign wage rates, continue to take a bigger and bigger piece of the consumer dollar. This is not only due to higher inflation in services relative to goods (4% annually compared to 2.4% for goods, Table 1), but also because services become relatively more important once demand for goods begins to top out.
We can also see from Table 1 several ways that consumers are savvy and sensitive to price: We buy relatively more recreational vehicles, electronics (in other durables), and clothing in response to the low and/or falling prices of these goods. Meanwhile, in the face of rising gasoline and fuel prices, we economize on energy consumption, through smaller and more fuel efficient cars, fewer trips, more public transportation, and better home insulation. In fact, while energy prices have risen 40% faster than all consumer goods and services as a whole (4.7% compared to 3.3%), the American consumer has so successfully economized on energy usage that spending for energy actually takes a smaller share of the consumer dollar today than in the early postwar years (3.7% versus 4.6% in 1950-52, Table 1).
Food benefits little from the savings offered by low cost imports and foreign competition. Like services and in contrast to most durables and soft goods, food is less affected by imports and fresh produce imports are negligible. From our calculations in Table 1, we can see that food at home (technically termed by BEA, food and beverages sold commercially for off-premises consumption) has increased at an average rate of 3.1%, which is only slightly less than the 3.3% average annual inflation rate for the total market basket of consumer goods and services as a whole. Food is less influenced by imports because domestic agriculture, much of which is government-subsidized, is competitive globally and because food is subject to spoilage, so it travels and keeps less well than hard goods and non-food nondurables. Table 1 also indicates that, even though the price of food has outpaced the prices of durables and most nondurables, consumer spending for food, due to slower unit growth, has risen at a slower 4.9% rate than all other major categories of goods and services (except clothing and footwear).
The biggest price increases affecting consumers are in three major areasservices (4.0%), food (3.1%), and energy (4.7%)compared to 2.4% for total consumer expenditures (PCE). In contrast to food and energy, where consumers have slowed their rate of spending, individuals seem less price-sensitive to services, which have grown at an average real rate of 3.5%. Health care services (essential) have grown at a 4.1% real rate, but so too have recreational services (a discretionary purchase). Perhaps the rather inelastic demand for essential as well as discretionary services reflects demographics, general postwar affluence, the greater availability and types of services, and the time crunch experienced in working households. Meanwhile, while rising prices have encouraged consumers to cut back on food and energy, bargain pricing has lured individuals to stock up on durables and apparel.
Copyright 2014, Pathways4Health.org
